Executive overview
Sales, collections, visits, coverage and targets in one view.
Insights & Analytics
Meydara dashboards connect sales, coverage, collections, receivables, inventory and execution across company, territory, team, representative, customer and product.
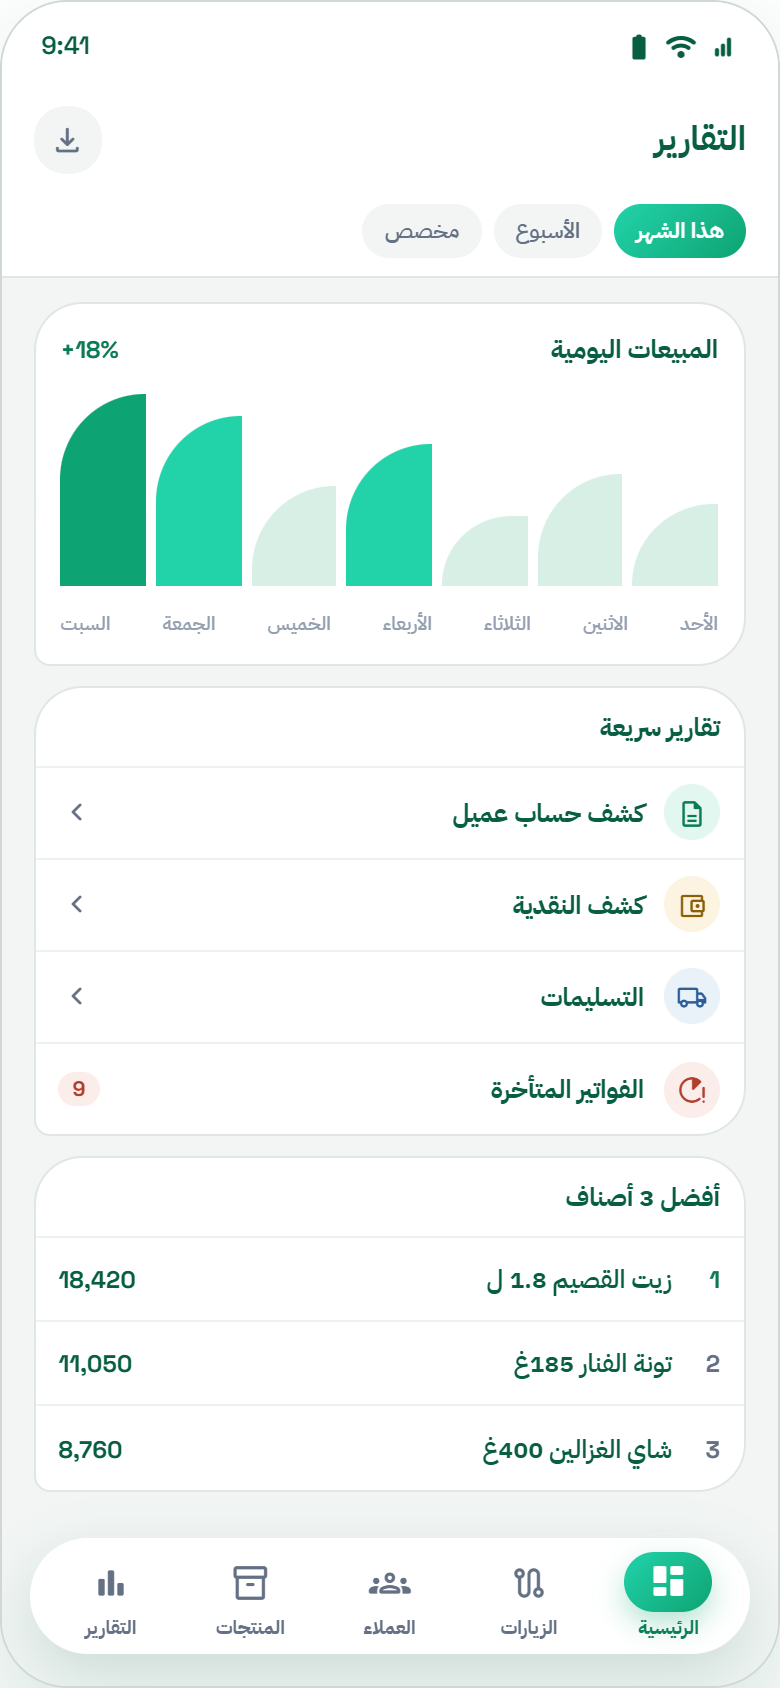
THE MANAGEMENT VIEW IN ODOO
Review sales, invoiced amounts, collections and orders in one dashboard. Change the reporting period, refine the filters and move between charts and detailed tables.
Explore reports and dashboards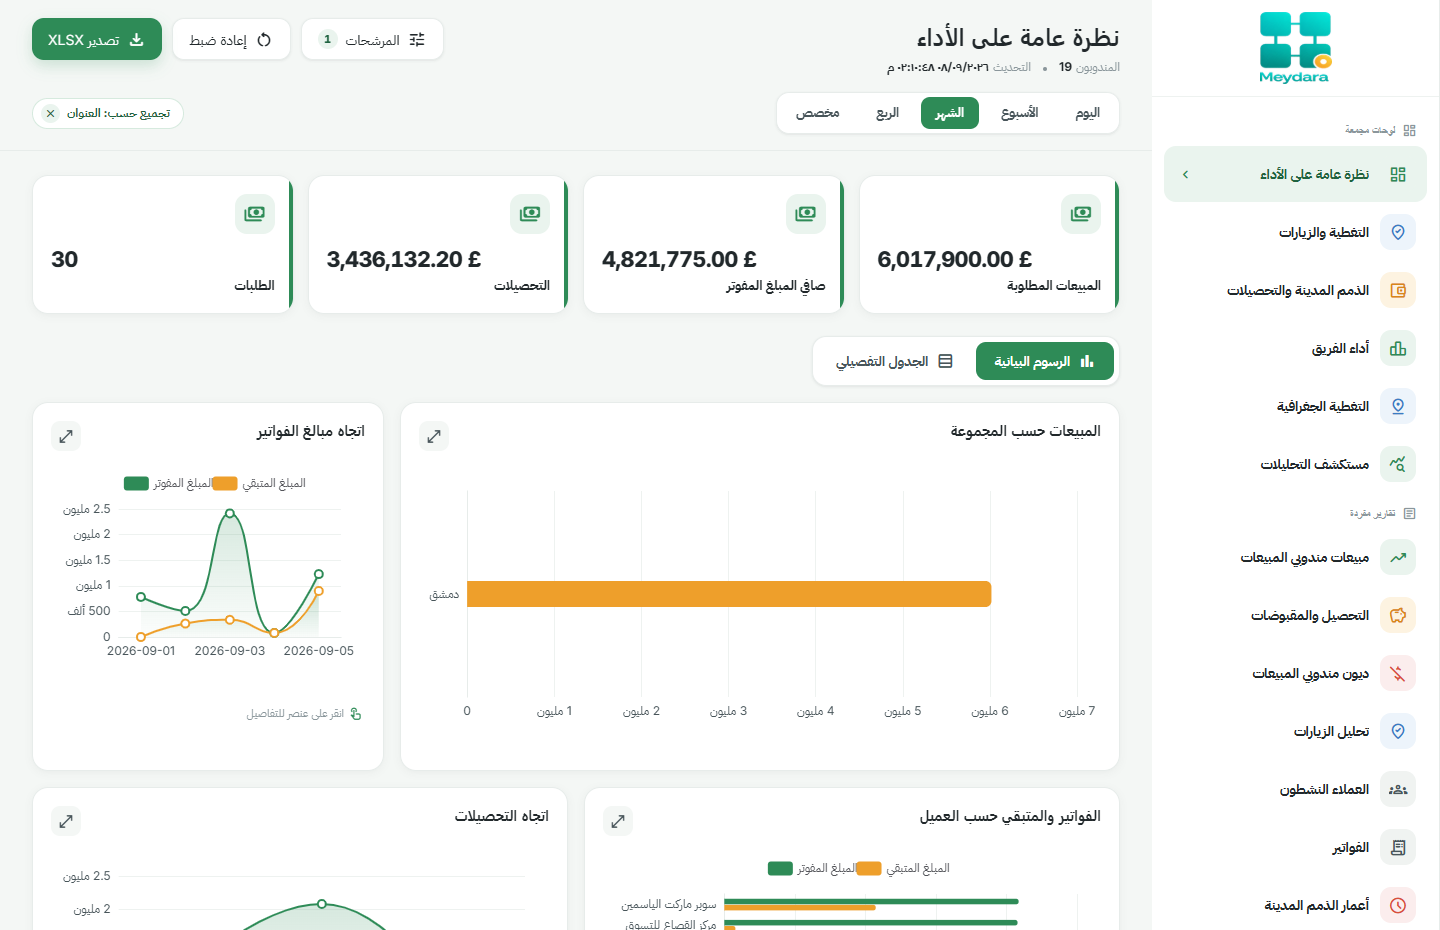
ROLE-BASED DASHBOARDS
Each user starts with the indicators needed to make a decision.
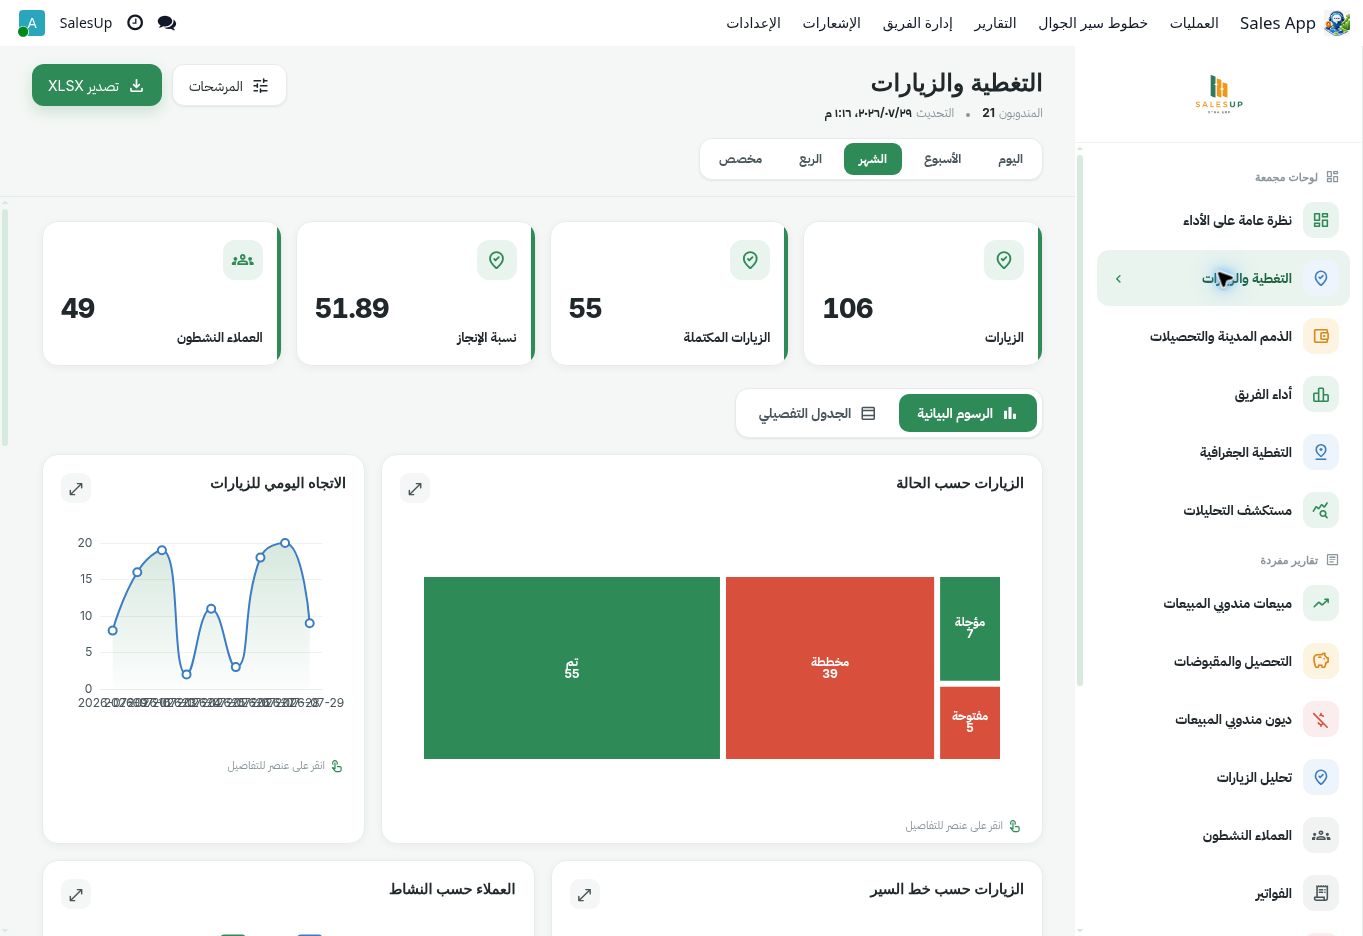
Sales, collections, visits, coverage and targets in one view.
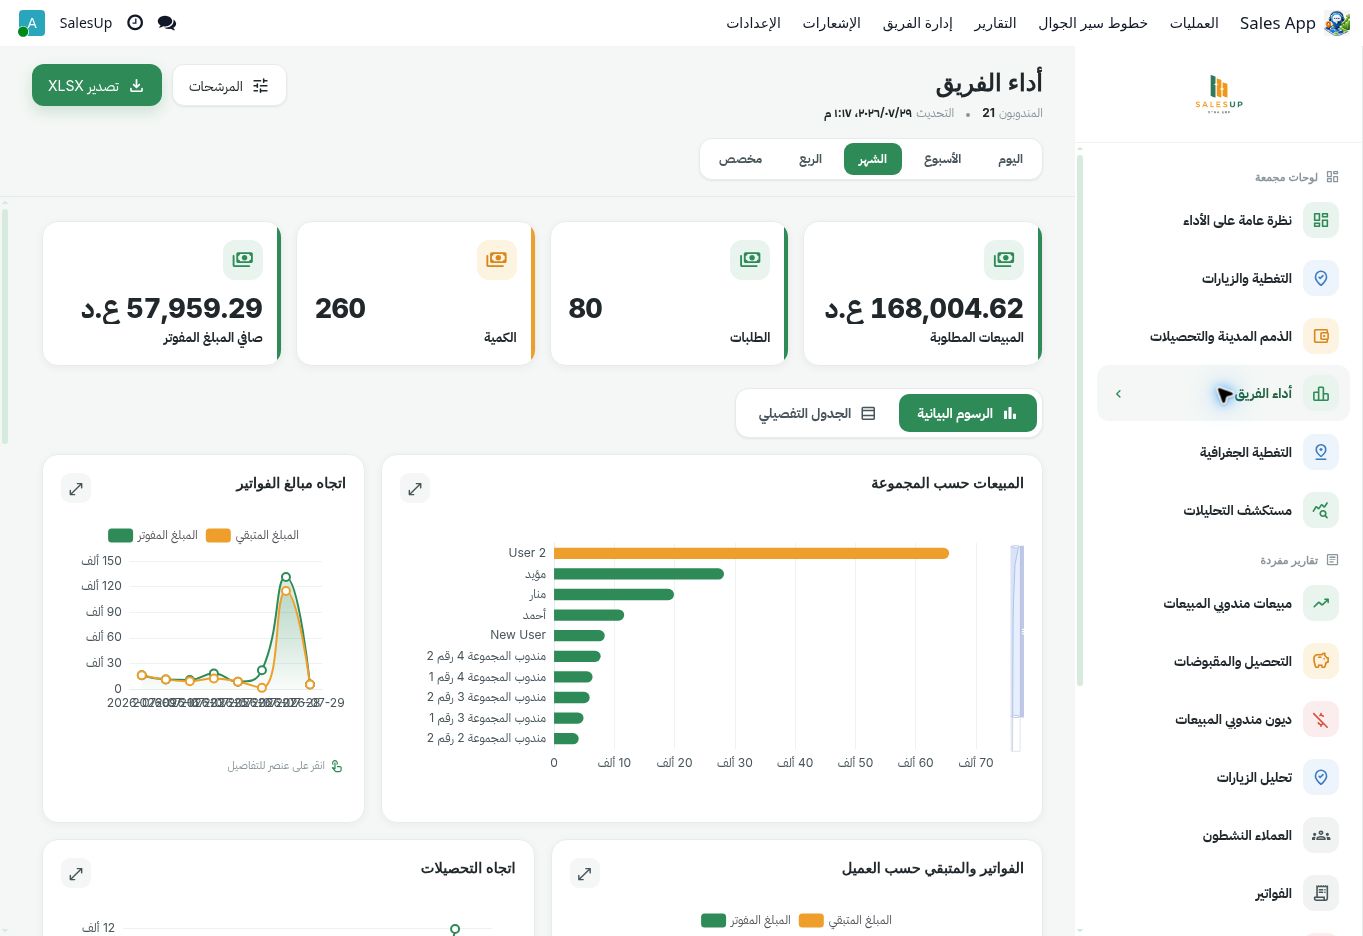
Representative ranking, productivity, productive visits and average basket.
Planned versus completed coverage by territory, segment and frequency.
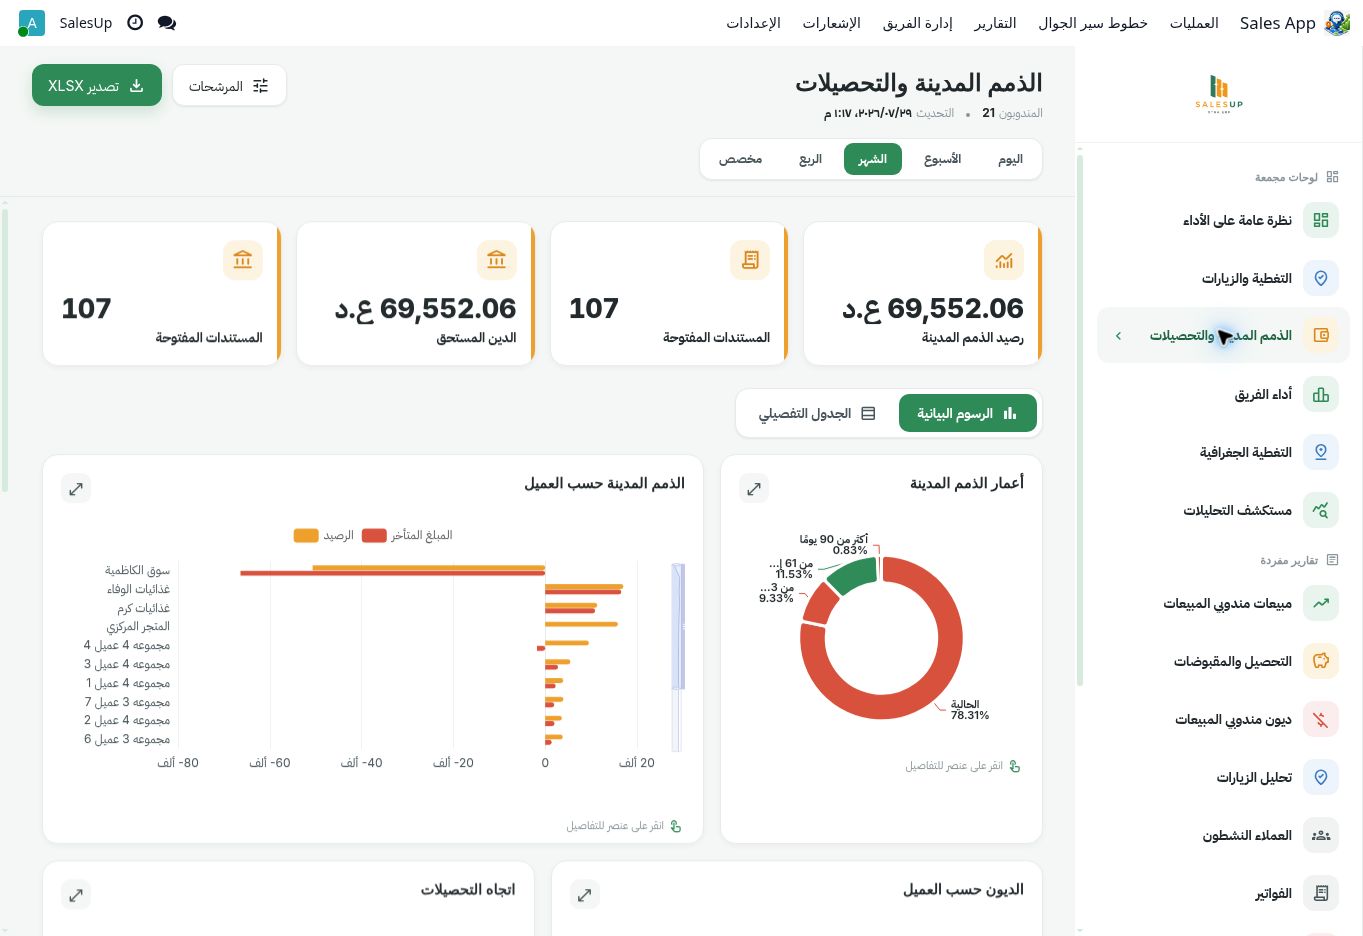
Total receivables, overdue balances, aging, promises to pay and collection performance.
Distributor and vehicle inventory, primary and secondary sales, returns and reconciliation.
Availability, out-of-stock, planogram, promotions and Perfect Store score.
DEEP ANALYSIS
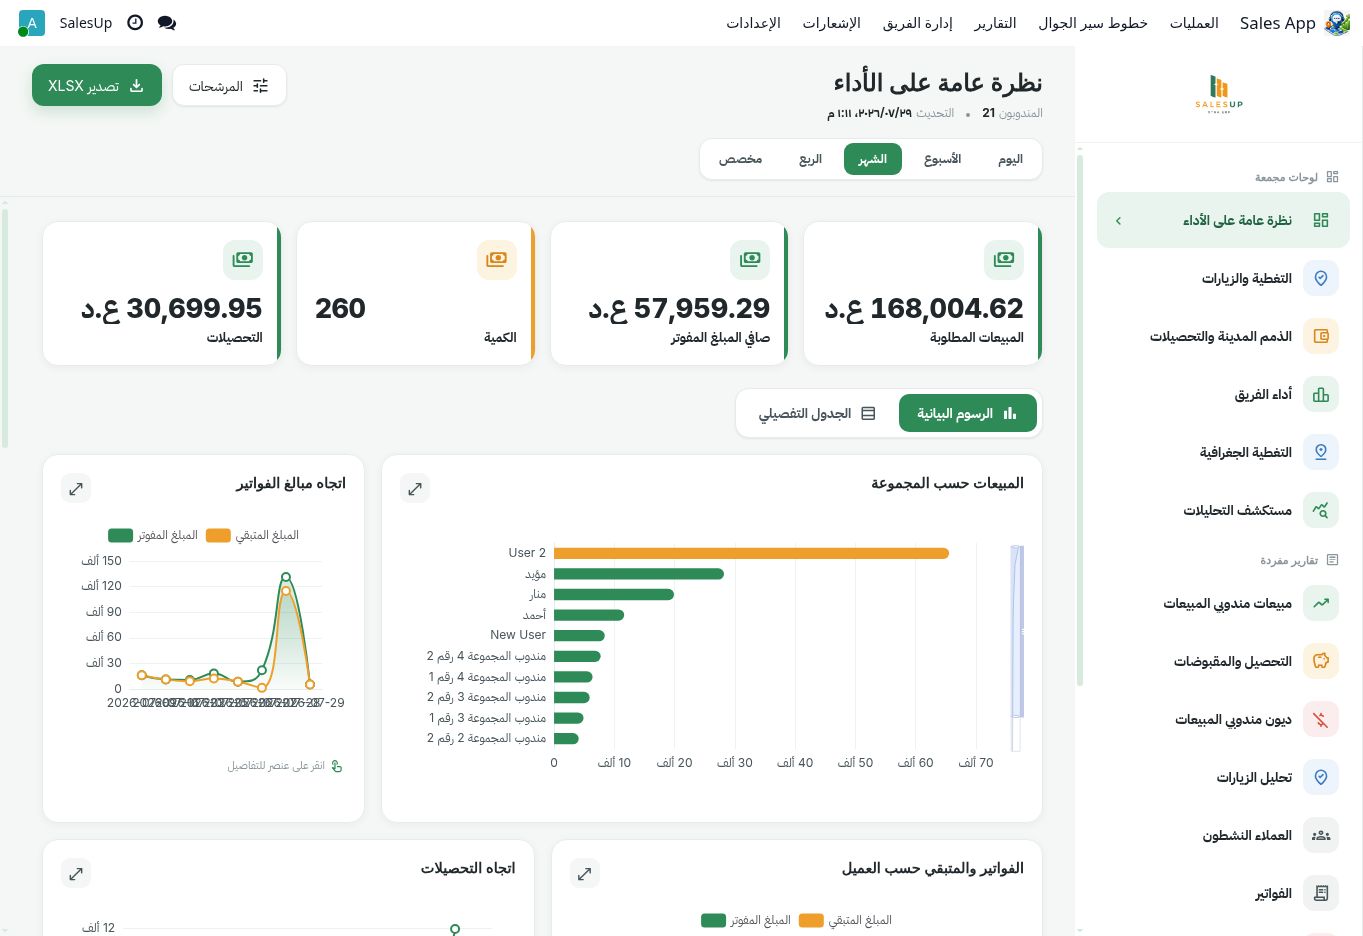
Move from a total indicator to the accounts, visits and products that shaped the result.
From company to branch, territory, representative, customer and document.
Date, company, channel, territory, team, product, customer and status.
Daily, weekly, monthly, year-on-year and plan comparisons.
Combine indicators and dimensions for each department’s needs.
Filter field images by campaign, store, territory and task.
Heatmaps, point maps and bubble sizes for geographic insight.
PROACTIVE REPORTING
Do not make managers chase the data; let the data reach them automatically.
Send periodic reports to management or branches on a defined schedule.
Notify when an indicator falls or exceeds a defined risk threshold.
End-of-day summary of completed, missed and exceptional activity.
Automatically explain important changes and their possible causes.
Excel, PDF or CSV according to the scenario and permission.
Return to the movements and changes that feed each number.